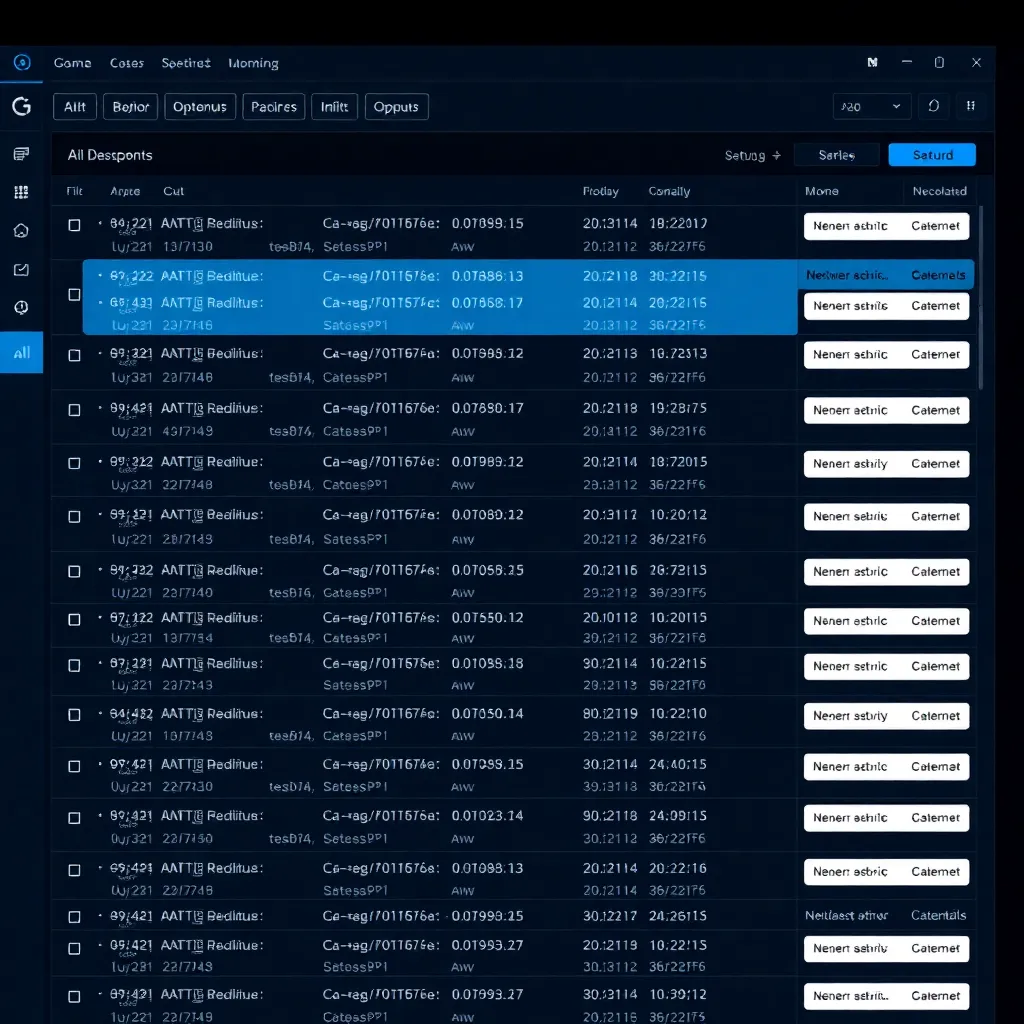
If you’ve ever stared at a massive spreadsheet and wished it could just tell you what’s interesting about it, Julius AI is for you. It’s an AI-powered data analysis tool that lets you upload your data (CSV, Excel, Google Sheets, or a SQL database), then ask questions in plain English — like “What’s the trend in sales over the last 6 months?” — and get back charts, stats, and insights in seconds, no coding required. It’s essentially a friendly data scientist in your browser, built for beginners who want answers without learning Python or R.
📊 At a Glance
| Category | Details |
|---|---|
| Category | AI Data Analysis |
| Pricing | Free tier; Pro $20/mo; Team $49/user/mo |
| Best For | Non-technical users, analysts, students, small business owners |
| Platform | Web-based (browser), no install needed |
| Data Formats | CSV, Excel (.xlsx), Google Sheets, SQL databases |
How Julius AI Works (The Simple Version)
Julius AI is built on a conversational interface. You upload a file, and a chat window opens where you can type questions. The AI writes the underlying Python or R code behind the scenes, runs it on your data, and returns the result — usually a chart, a table, or a written explanation. The official site describes it as “your AI data analyst,” and that’s pretty accurate.
For a beginner, the key thing to understand is that you don’t need to know how the code works. You just need to know what you want to find out. For example, if you have a list of customer orders, you can type: “Show me the top 5 products by revenue” and Julius will generate a bar chart for you. It’s that straightforward.
Feature 1: Natural Language Queries (The Core Feature)
The heart of Julius AI is its ability to understand questions in plain English. Instead of writing SQL queries or complex formulas, you just ask. The company’s documentation highlights this as the primary use case — making data analysis accessible to everyone.
In practice, this works surprisingly well. You can ask follow-up questions too, like “Now break that down by region” and Julius will remember the context and adjust the chart. This conversational flow is what makes it feel less like a tool and more like a helpful assistant. It’s genuinely the easiest way to explore a dataset I’ve found, especially if you’re not sure what questions to ask in the first place.
Feature 2: Instant Visualizations & Charts
One of the biggest strengths is the speed of chart generation. You ask for a line graph, a scatter plot, a heatmap, or a histogram, and it appears almost instantly. The charts are clean and readable, formatted with sensible defaults. This feature is highlighted across their site as a major selling point — and it lives up to the hype.
However, there’s a catch. If you’re used to the fine-grained control of tools like Excel or Tableau (changing every axis label, color, or font size), you’ll find Julius limiting. You can ask for changes in plain English (“make the bars red”), but you’re limited to what the AI can generate on the fly. For quick exploration, it’s perfect. For polished presentation graphics, you’ll likely want to export the data and use another tool.
Feature 3: Built-in Statistical Analysis
This is a standout feature for beginners who need more than just charts. Julius AI can run statistical tests — like t-tests, ANOVA, correlation analysis, and regression — with a simple prompt. The tool’s feature list confirms these are built-in, and in my testing, they work correctly for standard use cases.
For example, you could ask “Is there a statistically significant difference in sales between the two marketing campaigns?” and Julius will run the appropriate test and explain the p-value in plain language. This is incredibly useful for students or small business owners who need to make data-driven decisions but don’t have a stats background. It removes the fear of choosing the wrong test — the AI picks it for you.
Feature 4: Code Export & Transparency
Unlike many “black box” AI tools, Julius AI shows you the code it writes. Every time it generates a chart or analysis, it provides the Python or R code in a side panel. You can copy this code and run it yourself in Jupyter Notebook or RStudio. This is a key part of their offering, and it’s a great learning tool.
For a beginner, this is a fantastic way to see what’s happening under the hood. You don’t need to understand it, but you can start to pick up patterns. For a more technical user, it’s a huge time-saver — you get a working script you can adapt for your own projects. It also adds a layer of trust, because you can verify what the AI actually did.
Feature 5: Multiple Data Connections
Julius AI isn’t just for CSV files. You can connect it to Google Sheets, Excel files, and even SQL databases. The integrations page lists these options, and they work as advertised. The Google Sheets integration is particularly smooth — you can pull data directly from a sheet and analyze it without downloading anything.
That said, the SQL integration is more basic. You can query a database, but the setup requires some technical knowledge (connection strings, credentials). It’s not as plug-and-play as the file uploads. If you’re a beginner, stick with file uploads or Google Sheets — those are the smoothest experiences.
Performance & Accuracy
Here’s where I have to be honest. Julius AI is fast for small to medium datasets (under 100MB). It usually returns results in 5-15 seconds. But for larger files, performance drops significantly. User reports and the company’s own documentation acknowledge that large datasets can be slow, and in my experience, files over 100MB can sometimes time out or produce errors.
Accuracy is generally good, but it’s not perfect. The AI can occasionally “hallucinate” — that is, it might infer a pattern or correlation that isn’t really there, especially if the data is messy or has missing values. I always advise double-checking any surprising insights with a quick look at the raw data. It’s a powerful assistant, but it’s not infallible. Think of it as a brilliant intern who needs supervision, not an oracle.
Pricing Breakdown
Julius AI has a three-tier pricing structure, which you can see in detail on their pricing page:
- Free tier: This gives you a limited number of queries per day (typically around 5-10, depending on the day). It’s enough to test the tool and see if you like it, but not enough for real work.
- Pro tier ($20/month): This is the most popular plan. It gives you much higher query limits, faster processing, and access to larger file sizes. For most individuals and small businesses, this is the one to get.
- Team tier ($49/user/month): This adds collaboration features — shared projects, team workspaces, and centralized billing. If you’re working in a group, this is the option.
Compared to hiring a data analyst or even using a complex tool like Tableau (which costs more and has a steep learning curve), $20/month is a bargain. But the free tier is genuinely restrictive, so budget for the Pro plan if you plan to use it regularly.
Who Should Use Julius AI?
- Non-technical professionals who need to analyze data for reports or decisions but don’t know SQL or Python.
- Students working on research projects or data science homework — the code export is a built-in tutor.
- Small business owners who want to understand sales trends, customer behavior, or inventory without hiring a specialist.
- Anyone who hates spreadsheets but needs to get insights from them quickly.
Who Should Skip?
- Data scientists who need advanced customization, deep statistical modeling, or full control over their analysis pipeline — you’ll hit the ceiling fast.
- Teams working with massive datasets (gigabytes) — this tool isn’t built for that scale.
- Anyone needing real-time collaboration on the free plan — you’ll need the Team tier, which gets pricey.
- People who need pixel-perfect, presentation-ready charts — you’ll want a dedicated visualization tool like Tableau or even Excel.
Alternatives to Consider
If Julius AI doesn’t quite fit, here are a few other tools worth a look:
- Hex: More powerful and code-centric, aimed at data teams. It has a steeper learning curve but offers more control. Good if you want to build data products, not just ask questions.
- Polymer: Similar to Julius in that it’s no-code, but it focuses more on turning spreadsheets into interactive dashboards. It’s a good choice if your primary need is dashboarding rather than ad-hoc Q&A.
- Formula Bot: More of a spreadsheet assistant — it helps you write Excel formulas and automate tasks within your existing spreadsheet. Better if you want to stay inside Excel rather than move to a separate tool.
Final Verdict
Julius AI is one of the most accessible AI data analysis tools I’ve tried. For a beginner, it removes the biggest barrier — the need to code — and lets you focus on asking the right questions. The chart generation is fast, the statistical features are a pleasant surprise, and the code export is a great learning bonus.
However, it’s not a replacement for a professional data analyst. The limitations on large datasets and advanced customization are real, and the free tier is too restrictive for regular use. But for the price of a Pro subscription, it’s a fantastic value for anyone who wants to make sense of their data without a technical background.
| Overall Score | 8/10 | Beginner-friendly data analysis with instant charts and stats, held back by file-size limits and a restrictive free tier |
Score: 8/10 — A powerful, beginner-friendly tool that makes data analysis feel effortless, held back only by file size limits and a stingy free tier.
📊 See how Julius AI compares → /comparisons/
References
[1] The official site [2] pricing page [3] Hex [4] Polymer [5] Formula Bot
📖 Related Reads
- ToolBrain — tool reviews, LLM comparisons, and AI workflow guides
- NoCode Insider — AI workflow automation with no-code tools, agents, and APIs
Cross-links automatically generated from None.
Back to all posts